Your statistics
ECTLogger keeps a running history of every net you’ve checked into, and shows it back to you in two places: your own numbers on your profile, and where you stand against everyone else on a given net or schedule.
Your numbers
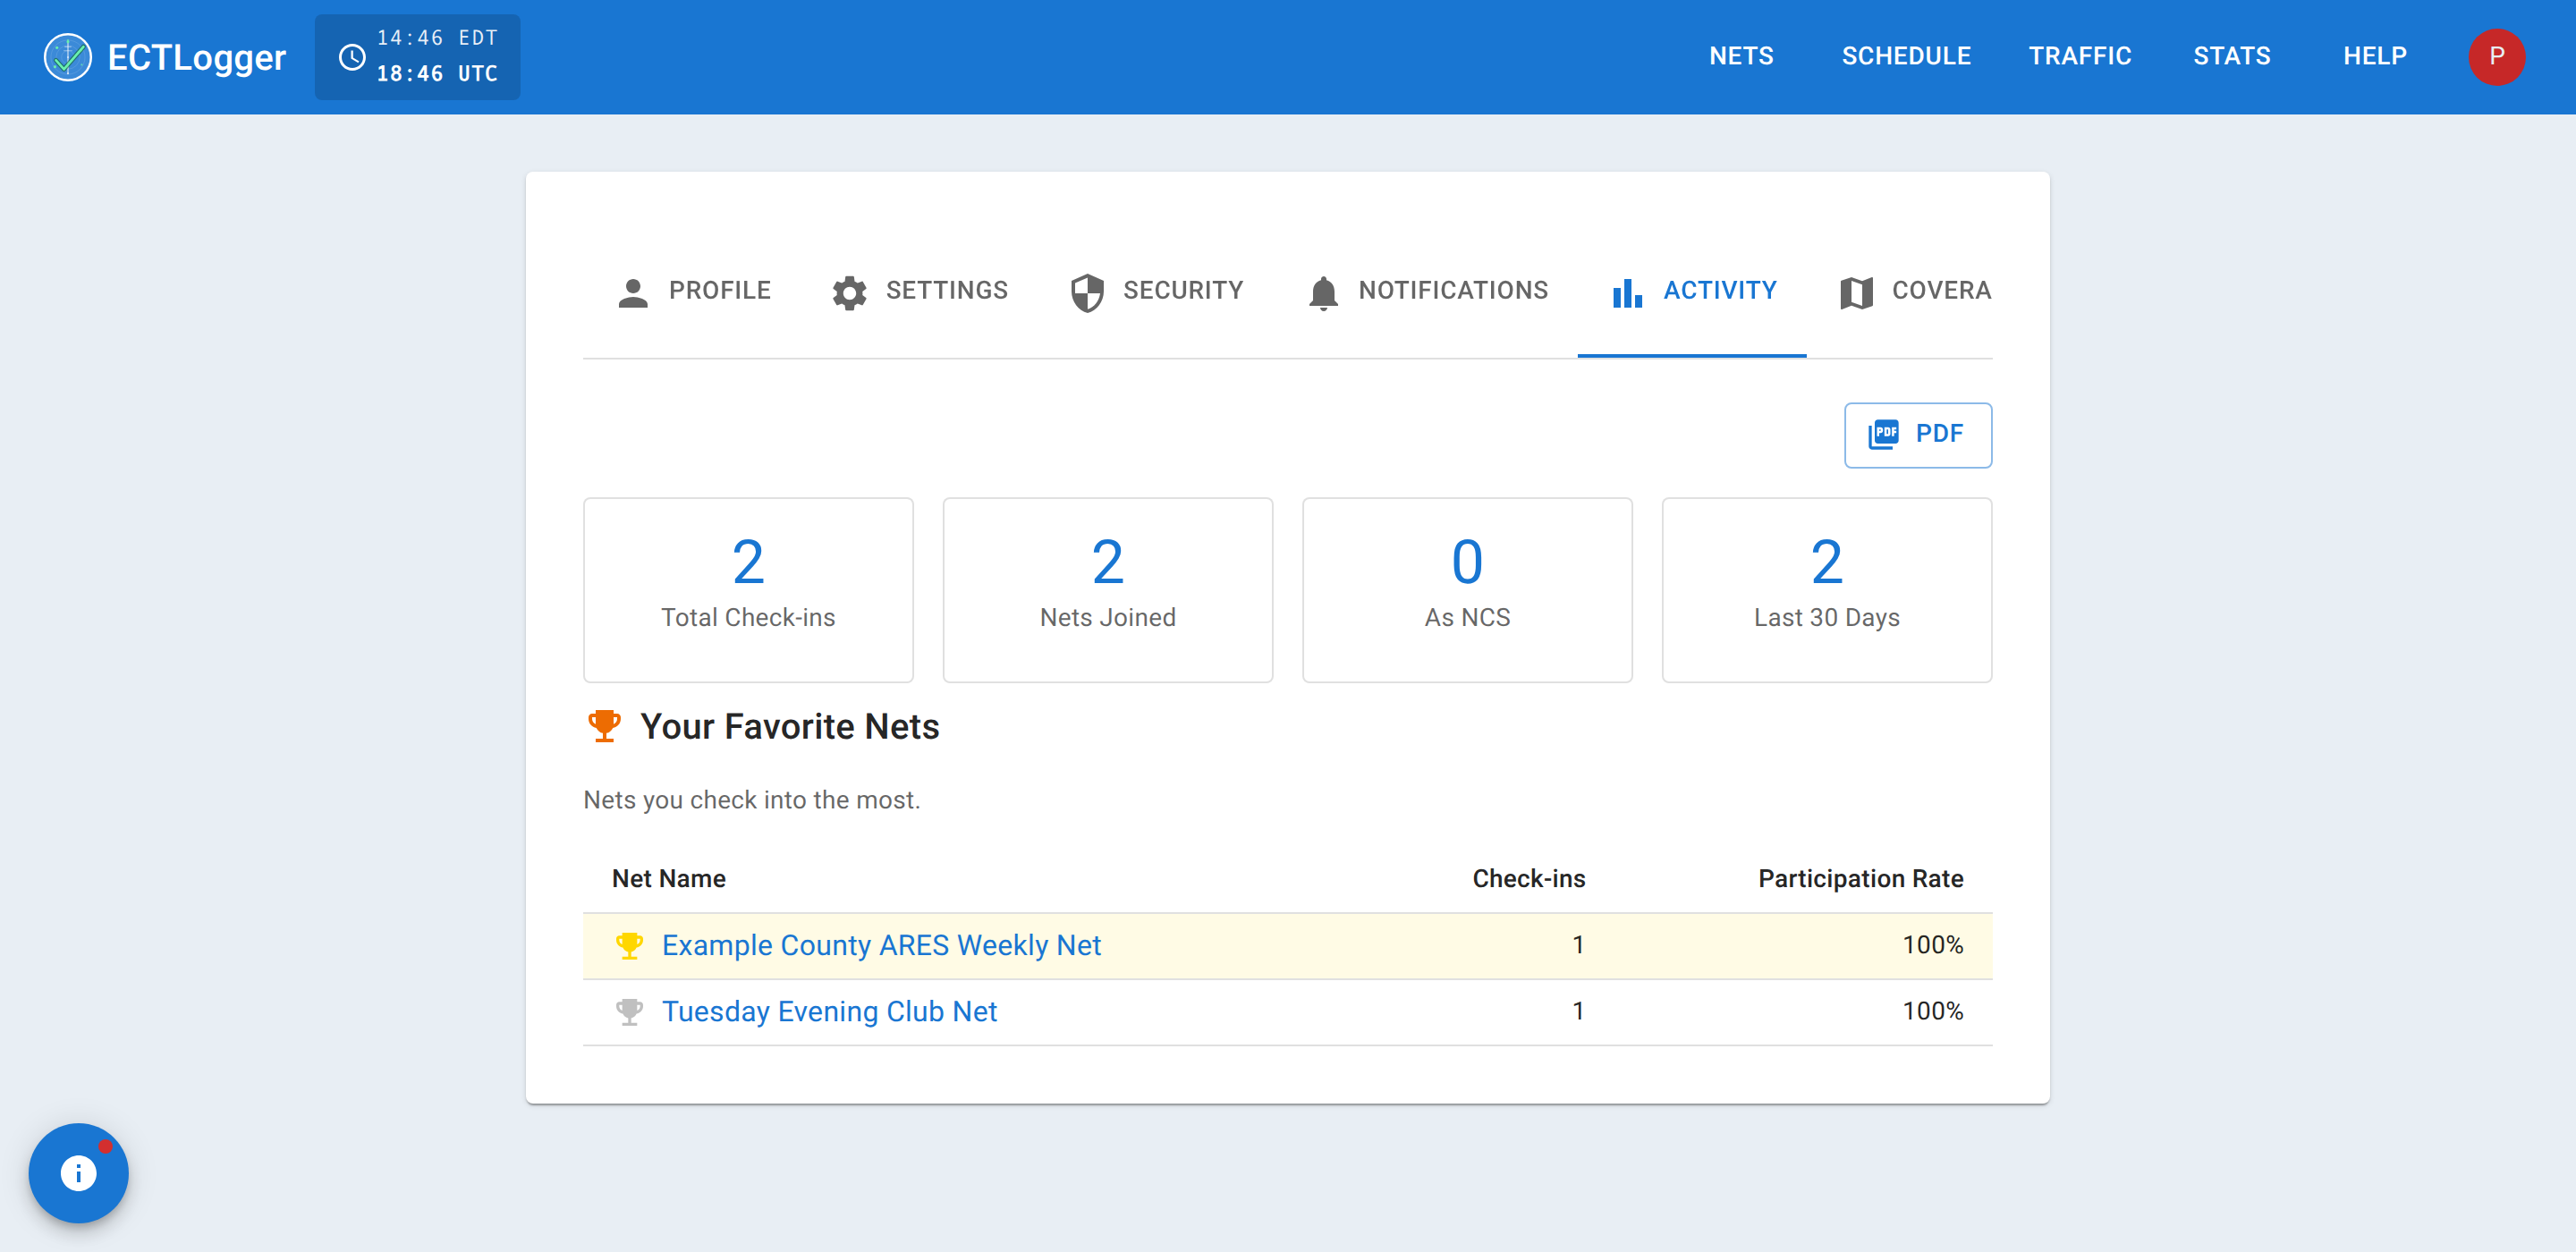
Profile > Activity shows a row of stat cards:
- Total Check-ins — every check-in you’ve ever logged, across every net.
- Nets Joined — how many distinct nets you’ve taken part in.
- As NCS — how many nets you’ve run.
- Last 30 Days — recent activity, for a quick “have I been keeping up” check.
- Traffic Handled and Traffic Pending appear once they apply to you — traffic you’ve originated, relayed, or delivered, and anything you’re currently holding that hasn’t moved yet. See Filing traffic.
Click any card to drill into the exact list of nets (or messages) behind the number, sorted and paginated. Below the cards, Your Favorite Nets lists the nets you check into most, with the top three marked gold, silver, and bronze, and each row expandable into your own session history for that net. A PDF button at the top exports the whole tab as a printable page.
Where you stand against everyone else
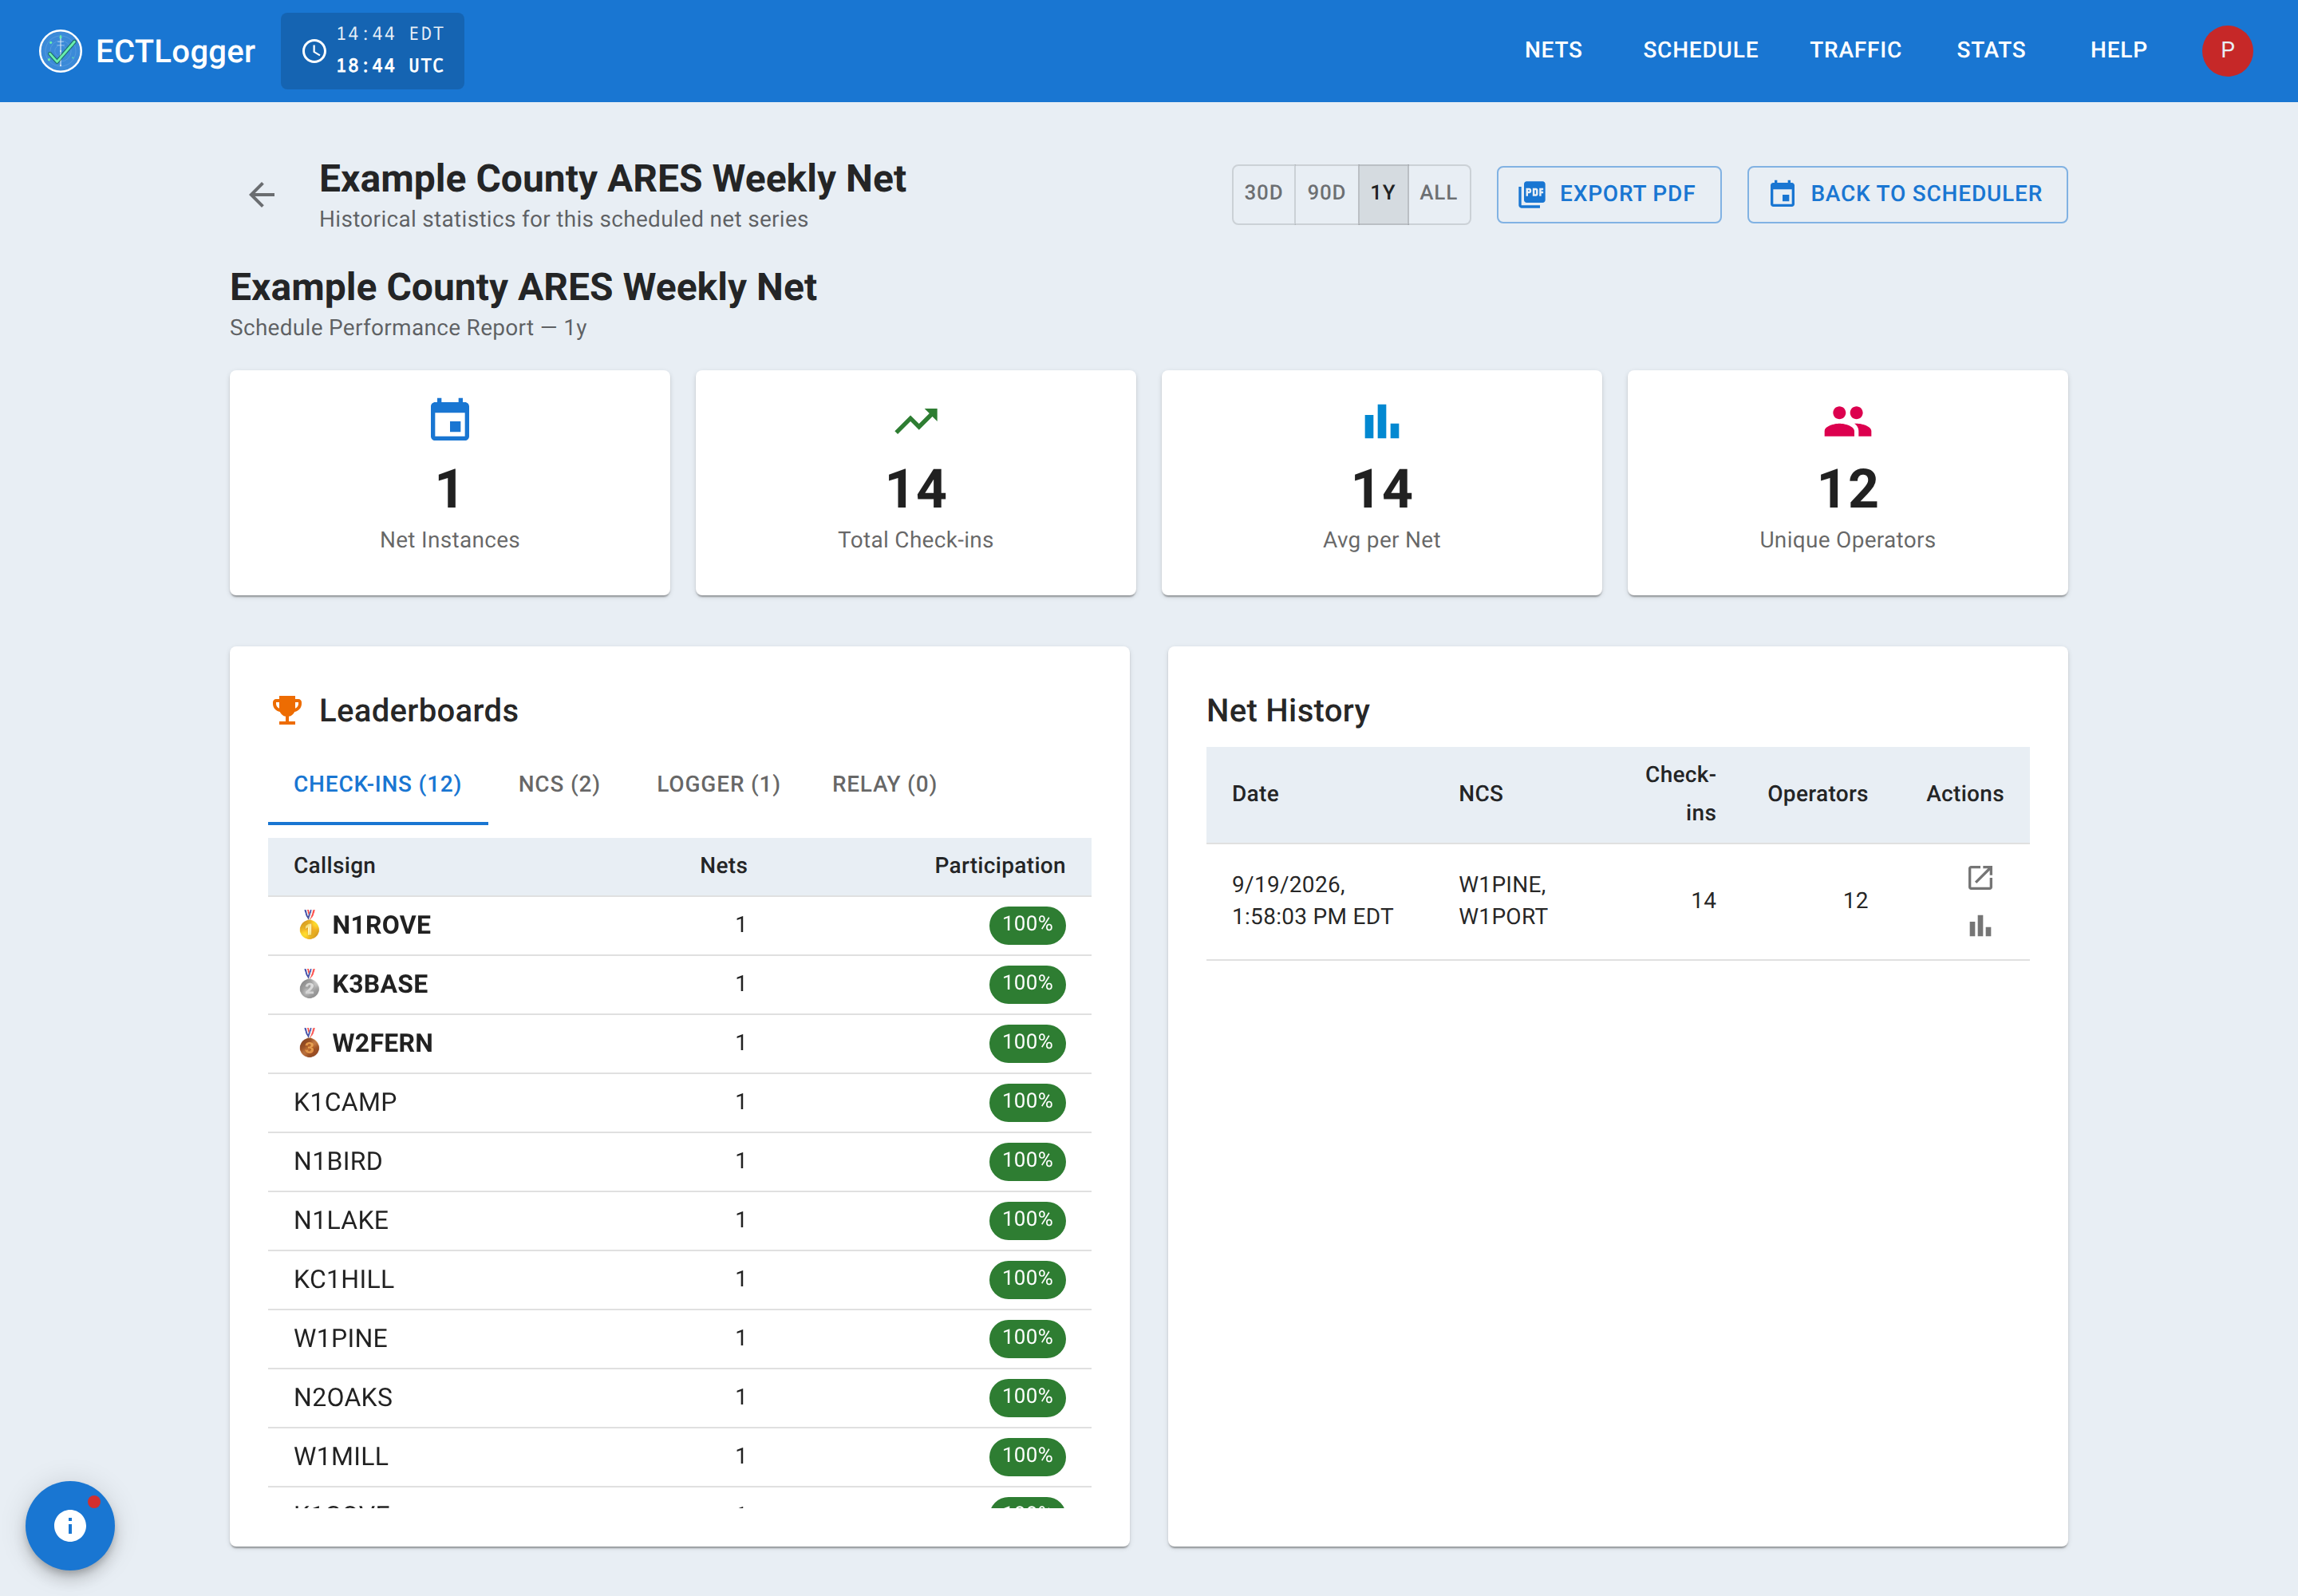
The site-wide Statistics section (reachable from the navbar, and browsable without signing in) covers a single net, a whole recurring schedule, or the instance as a whole. A schedule’s statistics page includes four leaderboards, each capped at the top 20 and each with a medal icon for the top three:
- Check-in leaderboard — ranked by how many of the schedule’s occurrences a callsign has appeared in, with the percentage of occurrences that represents.
- NCS leaderboard and Logger leaderboard — ranked by how many occurrences someone held that role.
- Relay leaderboard — ranked by how many occurrences someone relayed at least one station.
You can narrow any of them to the last 30 days, 90 days, a year, or all time.
The top-level /statistics page itself is instance-wide rather than per-net or per-schedule: Nets, Check-ins, and Operators tabs, each with trend charts over time and a global check-in map. It’s a good place to get a feel for how active the instance is as a whole, separate from either your own numbers or one schedule’s leaderboard.
Both views are reading the same underlying check-in history — your Activity tab is the personal cut of it, the leaderboards and instance-wide charts are the comparative ones.